This report can be found at Main Menu / Management Reports / Optimizer Report Menu / Schedule Compliance Report.
The OptimizerPlus+ Schedule Compliance report should be processed weekly and monthly.
OptimizerPlus+ Compliance reports can be generated based on a specified time period allowing management to review the overall compliancy of a driver and the route.

This report is processed by a date range for all OptimizerPlus+ routes and drivers. For the most accurate values, it is best to exclude Saturday and Sunday unless drivers actively deliver on those days. This report automatically opens in excel and auto-saves to the CSV folder located within the Energy Force data folder structure.

To process the report:
- Select Schedule Compliance Report.
- Input a date range in the From Date and To Date fields.
- If the driver does not actively drive on Saturday and Sunday, checkmark the Exclude Saturdays? and Exclude Sundays? options.
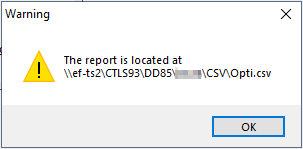
- Select Run Report. The system will begin to process and will indicate the report has finished and where a saved version can be found.

- Select OK and the report will automatically open in an excel file.

- Driver Name and Route Number – Each driver will be displayed separately.
- Opti Sched – This is the number of tanks/deliveries scheduled by the OptimizerPlus+ for the date provided.
- Opti Deliv – This is the number of deliveries made against the OptimizerPlus+ Route (compliant delivery).
- Percent Update – This is the number of percent updates against the OptimizerPlus+ Route (compliant delivery).
- Opti Sched OptimizerPlus+ Delivery Compliance – This is the compliancy percent for OptimizerPlus+ delivered gallons.
- Opti Deliv OptimizerPlus+ Delivery Compliance – This is the compliance percent for percent updates for routed OptimizerPlus+ tanks.
- Opti Deliv Total – This is the combined overall compliancy for deliveries and percent updates for OptimizerPlus+ scheduled tanks.
- Non-Sched. Deliv – This is the number of non-scheduled deliveries made for scheduled delivery date (non-compliant deliveries).
- Tot Deliv. – This is the total number of deliveries for all compliant and non-compliant tanks (excludes % updates).
- Mileage – This is the total miles driven for the delivery date.
- Gallons – This is the total gallons scheduled for the delivery date.
- This column does NOT reflect overall gallons delivered. For example, on row 10, the truck was parked this day because it displays 0 tanks and 0 gallons. There were 21 non-scheduled deliveries made for the day, but it does not reflect in the Gallons column.
- If a driver delivers on a parked route day, it does not count against the overall compliancy.
Each route number section displays the overall compliancy for the driver/route as well as the total number of deliveries, % updates, gallons, etc. for the time period. The report displays overall Delivery Compliance totals for all drivers/routes at the end of the report.

