Optimizer Compliance Reports are in the Main Menu / Management Reports / Optimizer Report Menu. Optimizer Compliance reports can be generated based on a specified time period allowing management to review the overall compliancy of a driver and their respective route. All routes display on the reports.

Schedule Compliance Report
The Schedule Compliance Report will contain an overview of each OptimizerPlus+ driver’s compliancy based on deliveries made that were scheduled by OptimizerPlus+ as well as the deliveries that were not completed.
This report is processed by a date range with the option to select specific Locations or Routes. It is recommended to Exclude Saturdays and Exclude Sundays unless drivers actively deliver on those days. This report automatically opens in excel and auto-saves to the CSV folder located within the Energy Force data folder structure as Opti.csv.

To process the report:
- Select Schedule Compliance Report.
- Input date range in From Date and To Date.
- Enter specific Locations or leave blank for all.
- Enter specific Routes or leave blank for all.
- If the drivers do not actively drive on Saturdays and Sundays, check the boxes for Exclude Saturday and Exclude Sunday.
- Select Run Report.
- The program will begin to process the report and once complete will indicate the report has finished and where the saved file can be found.

- Selecting OK automatically opens the report in Excel.
- Click the red X in the top right corner of the Optimizer Compliance Report to Exit.
Example Schedule Compliance Report:

- Specified parameters for the report.
- Driver Name and Route Number — Each driver will be displayed separately.
- Date of the schedule (time displayed is when the OptimizerPlus+’s schedule was created in Energy Force).
- Number of deliveries scheduled by OptimizerPlus+ for that date.
- Number of completed deliveries that were OptimizerPlus+ scheduled.
- Number of Percent Updates completed that were OptimizerPlus+ scheduled.
- Number of Non-Scheduled Deliveries completed (not OptimizerPlus+ scheduled).
- Sum of all completed deliveries for that date (excludes % updates).
- Total Mileage calculated by OptimizerPlus+ to drive on that day’s schedule.
- Total Gallons calculated by OptimizerPlus+ to deliver on that day's schedule.
- Sum of all Optimizer Scheduled Deliveries for that driver during the report date range.
- Percentage of completed deliveries and completed Percent Updates to OptimizerPlus+ scheduled deliveries.
- In the above illustration, Driver 14 completed 138 of the 191 scheduled deliveries to equal a 72.25% OptimizerPlus+ Delivery Compliance rate.
- Of the 191 Optimizer scheduled deliveries, Driver 14 completed 13 Percent Updates to equal a 6.81% OptimizerPlus+ Delivery Compliance rate.
- Combined OptimizerPlus+ Delivery Compliance rate of completed OptimizerPlus+ Deliveries and Percent Updates.
- For the date range of 1/1 – 1/12 (excluding weekends), Driver 14 delivered or performed a Percent Update on 79.06% of the OptimizerPlus+ scheduled deliveries.
- Tot Deliv. — Sum of deliveries made for the report date range.
- Mileage — Sum of OptimizerPlus+ calculated miles to drive for the report date range.
- Gallons — Sum of OptimizerPlus+ calculated gallons to deliver for the report date range.
The report will calculate a combined compliance rate and totals of all drivers listed in the report.

Opti Sched VS Truck Deliv Report
The Opti Sched VS Truck Deliv report is designed to show the number of deliveries, miles, gallons, and hours scheduled by OptimizerPlus+ versus what the driver delivered.
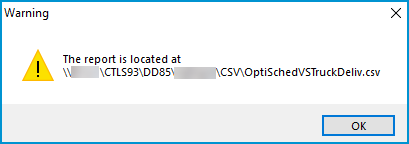
This report is processed by a date range with the option to select specific Locations or Routes. It is recommended to check the boxes for Exclude Saturdays? and Exclude Sundays? unless drivers actively deliver on those days. This report automatically opens in excel and auto-saves to the CSV folder located within the Energy Force data folder structure as OptiSchedVSTruckDeliv.csv.

To process the report:
- Select Opti Sched VS Truck Deliv.
- Input date range in From Date and To Date.
- If the drivers do not actively drive on Saturdays and Sundays, check the Exclude Saturdays? and Exclude Sundays? boxes.
- Select Run Report.
- The program will begin to process the report and once complete will indicate the report has finished and where the saved file can be found.

- Selecting OK automatically opens the report in Excel.
- Click the red X in the top right corner of the Opti Sched VS Truck Deliv to Exit.
Example Opti Sched VS Truck Deliv Report:

- The OptimizerPlus+ schedule information including how many non-scheduled deliveries made.
- The driver information from the imported Energy Track Trip.
- Total compliance details for the driver.
- Total compliance for all drivers combined.
Schedule Compliance Details
The Schedule Compliance Details report shows each customer account scheduled by OptimizerPlus+ as well as the customers that the driver delivered to that were unscheduled. An Explanation column is provided to allow management to take notes as to why a delivery was or was not made.
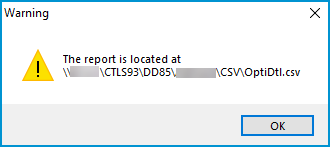
This report is processed by a date range with the option to select specific Locations or Routes. It is recommended to check the boxes for Exclude Saturdays? and Exclude Sundays? unless drivers actively deliver on those days. This report automatically opens in excel and auto-saves to the CSV folder located within the Energy Force data folder structure as OptiDtl.csv.

To process the report:
- Select Schedule Compliance Details.
- Input date range in From Date and To Date.
- Enter specific Locations or leave blank for all.
- Enter specific Routes or leave blank for all.
- If the drivers do not actively drive on Saturdays and Sundays, check the Exclude Saturdays? and Exclude Sundays? boxes.
- Select Run Report.
- The program will begin to process the report and once complete will indicate the report has finished and where the saved file can be found.

- Selecting OK automatically opens the report in Excel.
- Click the red X in the top right corner of the Optimizer Sched Compliance Dtl to Exit.
Example Optimizer Sched Compliance Dtl Report:

- Specified parameters for the report.
- Driver Name, Number and Route Number — Each displayed in separate columns.
- Customer details including Customer Name and Customer Number.
- Opti Run — If OptimizerPlus+ scheduled the customer, the OptimizerPlus+ scheduled Run will be displayed, if blank this was a non-scheduled delivery.
- Opti Sequence — If OptimizerPlus+ scheduled the customer, the OptimizerPlus+ scheduled Stop will be displayed, if blank this was a non-scheduled delivery.
- Opti Ticket — The delivery ticket invoice number from Energy Track, if blank the scheduled delivery was not made.
- These numbers should be in sequential order from Energy Track showing they were delivered in the order they were scheduled.
- Smaller numbers are Percent Updates.
- Opti Gallons are the OptimizerPlus+ scheduled gallons that were invoiced to the customer for that delivery.
- Percent Updates completed for OptimizerPlus+ scheduled deliveries.
- Non-Sched Ticket is the Delivery Ticket Invoice number from Energy Track for non-scheduled deliveries.
- Non-Sched Gal Dlvd are the invoiced gallons delivered for non-scheduled deliveries.
- Sales Journal ID with the deliveries.
- Explanation is a field provided by the program for documentation purposes.
- Total Tank Capacity.
- Delivery Type.
- Sum of all delivered Opti Gallons that were scheduled by OptimizerPlus+.
- Sum of all Percent Updates that were scheduled by OptimizerPlus+.
- Sum of the Non-Scheduled Deliveries.
- Sum of the Non-Scheduled Gallons that were delivered.
- Tank RRN
Multi-Day Schedules
The Multi-Day Schedules report displays the number of times a tank was scheduled before a delivery or Percent Update was made. A Ticket Number is an indicator as to when the delivery was made. If the delivery was made the 1st day it was scheduled, the tank will not appear on this report. If a delivery was not make when first scheduled, it will start to show on this report and will show an instance for each time until a delivery is made.
This report is processed by a date range with the option to select specific Locations or Routes. It is recommended to check the boxes for Exclude Saturdays? and Exclude Sundays? unless drivers actively deliver on those days. This report automatically opens in excel and auto-saves to the CSV folder located within the Energy Force data folder structure as OptiMultiDaySchedules_username.csv.

To process the report:
- Select Multi-Day Schedules.
- Input date range in From Date and To Date.
- Enter specific Locations or leave blank for all.
- Enter specific Routes or leave blank for all.
- If the drivers do not actively drive on Saturdays and Sundays, check the Exclude Saturdays? and Exclude Sundays? boxes.
- Select Print.
- The report will process and will automatically open in Excel. It will be named OptiMultiDaySchedules_username.csv where username is the Energy Force username for the current logged in user and saved in the CSV folder.
- Click the red X in the top right corner of the Opt Multi-Day Schedules to Exit.
Example:


