Map Basics
When the data has been rendered on the map your screen will look similar to the one below.
Layers Tab
The Layers tab is on the left side of the window and shows the different layers that can be displayed. If a layer’s box is checked then it is visible on the current Map tab. Un-checking it will hide that layer on the map tab. This is helpful in reducing map clutter by hiding layers when you don’t need them and showing them when necessary.
Note: Map layer loading does not load all layer data at the same time.
The order in which layers are drawn on the map is bottom to top. This means layers higher in the list will overlap and cover layers underneath them. In the picture above, the road layer is drawn first and will not obscure any other layer. This order may be changed by dragging a layer up or down the list to the desired position or selecting a layer and using the up and down arrows above the layer names.
Right click on a layer and zoom to the extents of the objects on that layer.
Map Tab
The Map tab displays the visual representation of the data for each visible layer. Each layer has its own style or rules for displaying itself.
Navigating the Map tab can be done in two ways. The first will be with the scroll wheel on the computer mouse. By rolling the wheel forward the map will zoom in, rolling it backwards will zoom the map out. If the scroll wheel is a clickable button, click and hold the wheel down and move the mouse to pan the map around. The second is by using the zoom and pan functions under the Palette. If the zoom button is active, left click and drag to create a box that will zoom the map to the size of the box drawn. If the Pan button is active, left click and hold and move the mouse around to pan the map.
Table View Tab
The Table View tab displays the raw data of the selected layer. In the image below the Propane Tanks layer has been selected and the Table View has been filled out with its information. The table is sortable by clicking on column headers to rearrange the data: once for ascending, twice for descending. 
- Direct searching is used to search specific columns (or all columns using the Any option). Select the desired column, enter the search value in the text box, and press Enter.
- The Wildcard option to the right of the search box determines if the percent symbol (%) is processed as a wildcard. If not checked then the percent is treated as a percent sign. If it is checked then searching for partial strings is allowed (e.g., find tanks painted in the 1990s using the search string 199% or find all customer with Smith in their names using %Smith%).
- Custom searching is allowed by using the Custom Query option at the bottom of the drop-down box. This option ignores the wildcard setting but does allow partial searching using the LIKE keyword. Custom queries allow for many complex ways to search the data. For example:
- To find all auto-fill tanks in route 1 or 3 but not in location 15
- DeliveryType = ‘AUTO FILL’ AND (Route = 1 OR Route = 3) AND Location <> 15
- To find all company-owned tanks which have not been painted since 2004 (but ignore blank years)
- CompanyOwnsTank = ‘Y’ AND LastPainted < 2004 AND LastPainted <> 0
- To find all roads with Main in their name but not S Main
- FULLNAME LIKE ‘%Main%’ AND FULLNAME NOT LIKE ‘S Main%’
- To find all auto-fill tanks in route 1 or 3 but not in location 15
- If a search term or custom query does not return expected results, then verify all spelling and capitalization are correct to ensure proper matching. If items are found matching the criteria there will be a value in the Features Selected field above Division.
- If these values are not showing in the Table View, use the Promote Selections to Top feature to list the selected items at the top of the Table View tab.
Note: EnergyMap is now looking at customer division as well as customer number. This alleviates issues of displaying the correct information when there are multiple customers with the same customer number in different divisions.
The Table View also has its own toolbar in the upper right of the tab. The following are the functions of each of the items in the toolbar from left to right.
- Box Selection – Draw a box around multiple items and those items will then be highlighted in both the Map View and the Table View.
- Show Selected Items – This will zoom and re-center the Map View to show the highlighted items in the Table View.
- Promote Selections to Top – This will move all highlighted items in the Table View to the top of the table.
- Remove Intersections – This is only active if the Roads layer is selected and the network layer is installed on the map. This will allow removing the intersection for two roads. For example, if the map shows an intersection between two roads but on is an overpass, remove this intersection because a turn can not be made onto the secondary road from the overpass.
- Update Selected Road Info – This is only active if the Roads layer is selected and the network layer is installed on the map. This allows updating the information about the currently selected road.
- Create Intersections – This is only active if the Roads layer is selected and the network layer is installed on the map. This allows creating an intersection between two roads.
- Delete Selected Road – This is only active if the Roads layer is selected and the network layer is installed on the map. This allows deleting the selected road.
- Join Roads at Ends – This is only active if the Roads layer is selected and the network layer is installed on the map. This allows selecting two roads and joining them at their closest ends using a straight line.
Note: Any time the road edits are used and the network layer is in place Save and Re-Compute the Roads layers. This will allow the network layer to use the newly edited road information. If the network layer is not installed still save the Roads changes to ensure that they show properly moving forward.
Toolbar
The toolbar houses both basic and some advanced icons that are universally used among all layers. Use of menu commands and other tools is not supported for normal usage. Below, the toolbar icons will be described as shown from left to right. 
- Create a Page to be Printed – Allows creating a PDF image of the map that can then be saved and printed. Zoom to the area to print and then select this icon; a prompt displays for a page size to create. Once the page size is selected, a new tab in the Map View will be created showing the image. Select the Adobe icon in the toolbar at the top and choose where to save the PDF image. Once saved it can be opened and printed.
- Back – Will return to the previous zoom level.
- Forward – If zoomed to an area and then select the Back button to return to the previous area, pressing Forward will return to the zoomed area prior to selecting the Back button.
- Redraw Map – Forces the application to re-draw (refresh) all items on the Map tab.
- Stop Drawing – Stops any current rendering action on the map.
- Zoom to Max View – Re-draws the Map tab so all visible layers are completely in view and the largest visible layer is edge-to-edge within the screen.
- Zoom In – Zooms in by a small increment. Roll the mouse wheel forward to accomplish the same functionality.
- Zoom Out – Zooms out by a small increment. Roll the mouse wheel backwards to accomplish the same functionality.
- Show Selected Data – Centers the map on the selected item(s) using a close zoom. Useful for panning away from a selected item or selected data in the Table View tab which is outside the Map View tab.
- Open Settings – This will open the settings window to enable\disable filters, adjust the GPS refresh rate (on Truck Computers) and modify certain style parameters.
- Commit Layer Changes
- Commit Route Boundary Changes
- Recalculate Tanks Using Map Boundary Lines
- Reload Map Layers
- Load Data to Layer
- Load and old schedule for viewing
- Display Truck Tracking History
- Toggles auto-center on or off
- Cancel Previous Road Edit
- Save Current Road Set
- Rollback Changes
Filters Tab
This tab enables the filtering of which tanks to view on the map. These filters enable features that can cut down on the number of tanks shown on the map and only view tanks chosen to view. 
- Show Auto-fill tanks which are between – This allows to only show Auto-fill tanks that have an estimated percent left that is within the chosen range.
- Show Julian deliveries due within the next – This will only show Julian deliveries that have a next scheduled date within the number of days from today that is entered.
- Mark Julians critical if they are at least – This will modify the symbol of Julian deliveries to match the critical parameter if the next scheduled date is more than the number of days entered past the scheduled date.
- Show tanks with zero gallons to deliver – This will show any tanks where the estimated gallons to deliver is 0.00.
- Show call-in tanks with no active entry – This will show any call-in delivery type tanks that do not currently have an active call in assigned to it.
- Show tanks that are on hold – This will show any tanks that are actively on hold.
- Show tanks with at least – This will show any tank that has an estimated number of gallons to deliver that is more than the number entered.
GPS Tab
The GPS tab will allow you to change the refresh rate on the GPS polling for Fleet Tracking and turn on\off the Auto-center GPS Marker on the Truck Computers. 
Tank Styles Tab
This tab will allow you to change the style of some of the basic layers of the map. The changes made in this tab are user specific and will be saved per user once the map is closed.

- Auto-fill – This sub-tab will allow modifying the Symbol, Size, Outline and Rotation for the Critical, Target and Above Ranges. It will also allow modifying the Target and Critical Thresholds for these tanks.
- Call In – This sub-tab will allow modification of the Symbol, Size, Outline and Rotation for the Immediate Fill or Active Call Ins that show up on the map.
- Julian – This sub-tab will allow modification of the Symbol, Size, Outline and Rotation for the Overdue and Active Julian deliveries.
- Routes – This sub-tab will allow modifying the color of the tanks for each route.
- Lines – This sub-tab will allow modification of the thickness and color of the Boundary lines and the lines denoting scheduled deliveries.
Road Styles Tab
This tab will allows adjusting the display of the roads on the map.
- Commit Layer Changes – This is a committing tool. Use this to commit all changes to the database. Data is saved only if it is marked as changed and afterwards is no longer regarded as such (committed). Any other committing actions performed prior to clicking the Commit Layer Changes button will cause this tool to take no action until further changes are made to layer data.
- Commit Route Boundary Changes – After making modifications to the route boundary, this tool is used to save the new boundaries to the map so a re-route can be performed. This is a non-committing tool and only affects the route boundaries.
- Re-Route Tanks Using Map Boundary Lines – This is a committing tool. Use after the Commit Route Boundary Changes tool to apply the new boundaries to the tank set. After clicking the tool, a prompt will appear asking for confirmation to continue. If a well-defined boundary exists for a route, then the application will re-assign all tanks within the boundary to that route. All tanks are saved to the database or local file when the re-route is performed. Currently only the Propane Tanks layer is re-routed.
- Re-Load Map Layers – This is a committing tool. Reloads the map using fresh data from the database or local files. Choose to switch data sources or modes at this point. All unsaved changes will be lost. See the Loading a Data Source section above for instructions on loading a data source.
- Load Data to Layer
- Load an Old Schedule for Viewing – Select a day and compare the scheduled deliveries to the actual deliveries based on the history of the trip.

- Display Truck Tracking History – Currently displays an accelerated history of a truck’s deliveries given in a historical GPS data file. Click the tool and a clock, Play, Pause, and Restart button will be added to the Status Bar. Click the tool again to hide them. If a valid history file is present, then pressing Play allows the simulation to begin. As the clock moves forward trucks will appear and move as their recorded GPS positions are reached. Pressing Pause will halt the simulation until resumed and Restart will set the clock back to the start.
Note: Historical data files must be in the correct format for the map to understand and display the trucks. Please contact software support for more information.
- Toggle Auto-Center On/Off – This is used on the Truck Computers to turn on or off the auto-centering of the map. On a truck computer that has GPS installed, an arrow will show the current location of the truck. The auto-centering will pan the map when the truck reaches the edge of the current view of the map, thus keeping the real time position always centered on the map.
- Start Navigation on Selected Schedule – This can be used on the truck computers to start the Turn-by-Turn navigation for a selected schedule.
- Cancel Previous Road Edit – This will cancel the previous road edit as long as the Save Current Road Changes has not been selected.
- Save Current Road Set – This will save any modified road information on the map like road names, speeds or direction. Any time road information is modified, select this feature so that the information is saved for future use.
- Roll Back Changes – This is a committing tool. Reverts all changes since the last committing tool was used.
Palette
The Palette tab on the right side of the map houses some of the advanced functions of the map. Click on any of the sub-tabs to expand the section for the advanced functions.

- Info – The Info sub-tab will gives options for viewing info specific to an object on the Map View tab or it will allow to utilize the Distance tool to calculate the distance between locations on the Map View tab.
- Selection – The Selection sub-tab will allows drawing a box around multiple objects and viewing the information pertaining to those objects in the Table View tab.
- Scheduling – The Scheduling sub-tab allows for manual creation of routes on the map. Select either the Propane Tanks layer or the Other Non-Propane Tanks layer and click Create Schedule to begin. Click anywhere on the Map View tab to begin the scheduling process.
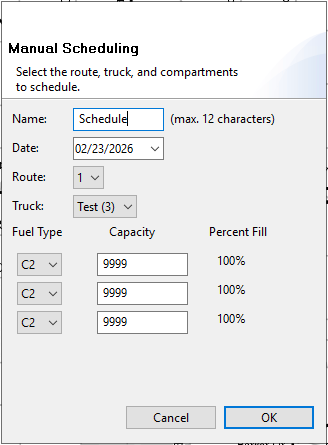
- Name – The user-friendly name by which the schedule will be known.
- Date – The date this schedule will take place.
- Route – The schedule will be created under this route. However, any tanks from other routes may be added to this schedule as well.
- Truck – The truck which will perform the deliveries in this schedule. The available compartments will change to reflect the selected truck’s capabilities.
- Every truck has one or more compartments for specific types of fuel.
- Fuel Type – The selected truck is limited to carrying certain fuels. This list contains the abbreviated types as defined in Energy Force. A single compartment may have only one fuel type defined.
- Capacity – Each compartment has a defined gallon capacity in which to store the selected fuel. This amount may be changed to the desired fill level.
- Percent Fill – As the capacity is changed, this reflects the percentage of the maximum capacity which is being used.
- Once the proper information has been defined and OK is clicked, the scheduling mode begins.
- Click the first tank to deliver and a dialog of the tank information will appear. Click Schedule to confirm adding this tank to the schedule. Depending on the speed of the local machine, this first tank may take a few seconds to register.
- Continue to click tanks belonging to the selected route to add them to the schedule.
- Note: On the left of the Status Bar is the remaining gallons in the truck for each type of fuel (when more than one compartment has the same fuel type, those gallons are combined into a single fuel listing). As tanks are added, the number is reduced by the recommended gallons needed to fill each tank.
- Click on a yard or remote fill location belonging to the selected route to refill the gallons on the truck to begin the next run. At this point, the Scheduling dialog prompt displays once more allowing changes to the products that are listed on the truck to deliver different products for a second run.
- To finish the current route’s schedule, press Shift double-click anywhere on the map. No need to click on the route’s yard before doing so; the route will automatically add the yard if it is not the last stop.
- Choose to continue adding routes to the schedule by clicking on the map again to open the Creation dialog, choose a schedule combination, and return to step 1.
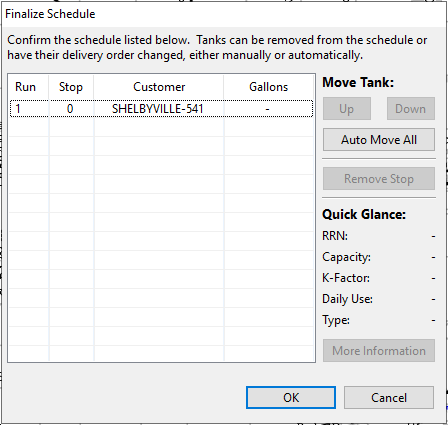
- Completing the route will end the scheduling mode and display the Delivery Verification window to review the schedule as it was created and to move deliveries up or down in the list or delete a delivery if it is not needed. Once this is completed select OK, the necessary layers will be filled out to commit the layer changes. The changes must be committed in order for the schedule to transfer into Energy Force.
- Boundaries – The Boundaries sub-tab will allow creating route boundaries on the map. If this is used it will overwrite any existing boundary lines.
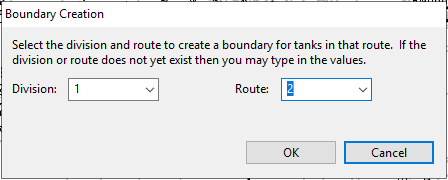
- Select the tool and click on the starting point of the boundary line to draw.
- The Boundary Creation dialog will appear. Select the Division and the Route # that you are creating then Ok.
- Start drawing a boundary by clicking the points on the map, once finished hold Shift and double click to complete the boundary (the map will automatically connect the last line to the first line when this is done).
- Continue adding additional boundary lines for each route needed. Once finished and satisfied with the boundary lines, select the Save Route Boundaries button in the upper task bar to commit the changes to the Boundary layer.
- Once the new boundary layer has been completed, the re-route tanks tool can be used.
- Note: Boundary lines can only be created for the Propane Tanks layer in this version of the map. This capability will be added for other tank types layers in a future release.
- Plot – The Plot sub-tab has the Plot tank option. Currently plotting of a tank needs to be initiated from within Energy Force using the plot function found there. Once the Plot function is initiated a Plot cursor displays on the map, click on the map at the location to plot the tank. Once tank is plotted, select the Save Layer Changes button.
- Detail – The Detail sub-tab allows pulling up the detailed information for the selected tank.
- Path Finding – This sub-tab is only used if the network layer is installed and finds the road path between two points on the map instead of a straight-line distance.
- Roads – The Roads sub-tab creates a new road or disconnect two existing roads. If this is used, the Save Current Road Changes tool will need to be used to save the information for future use.
- Editing – The Editing sub-tab allows for editing the geometry on the Map View tab.


